Since 1954
The power of community
Since 1954
The power of community


In June 2026, ASES hosted a workshop designed to empower women-identifying attendees with the skills to size a PV system, improve energy efficiency, and gain experience with quality installations. The curriculum covered optimal array placement for maximum production, as well as the configuration of both stand-alone (off-grid) and grid-tie systems. Participants engaged in hands-on labs, including the installation of an off-grid lighting system, with a comprehensive focus on safety throughout the process; no prior experience was required.
![]()
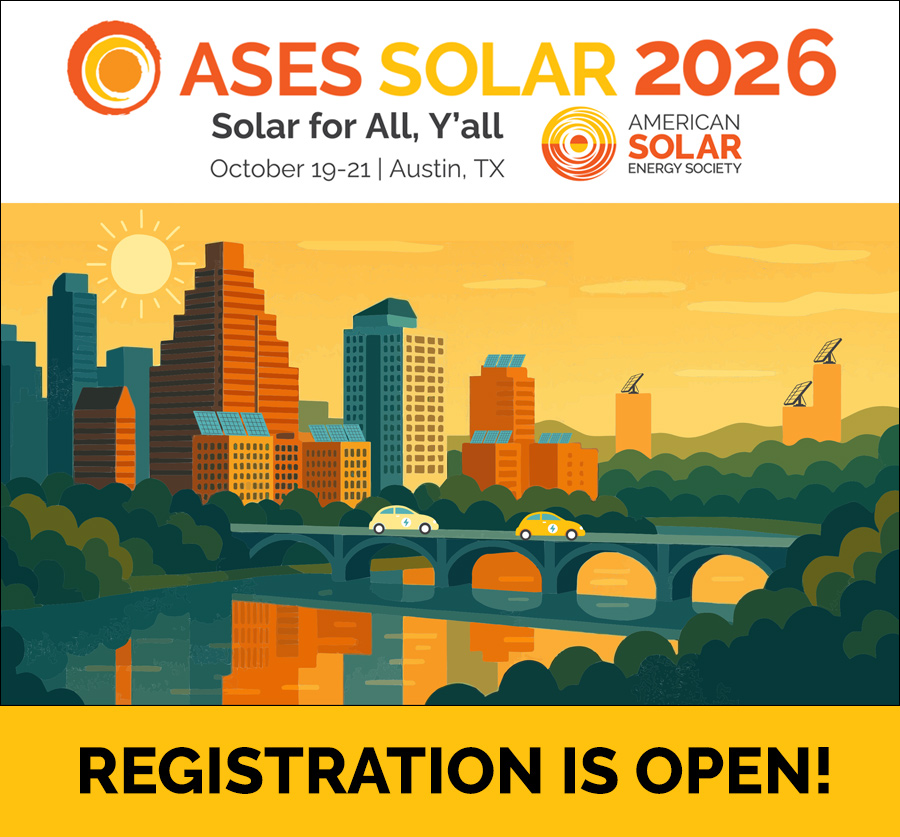
For sponsorship and advertisement opportunities, please contact Michael DeRosia at mderosia@ases.org. Learn more and register today
![]()
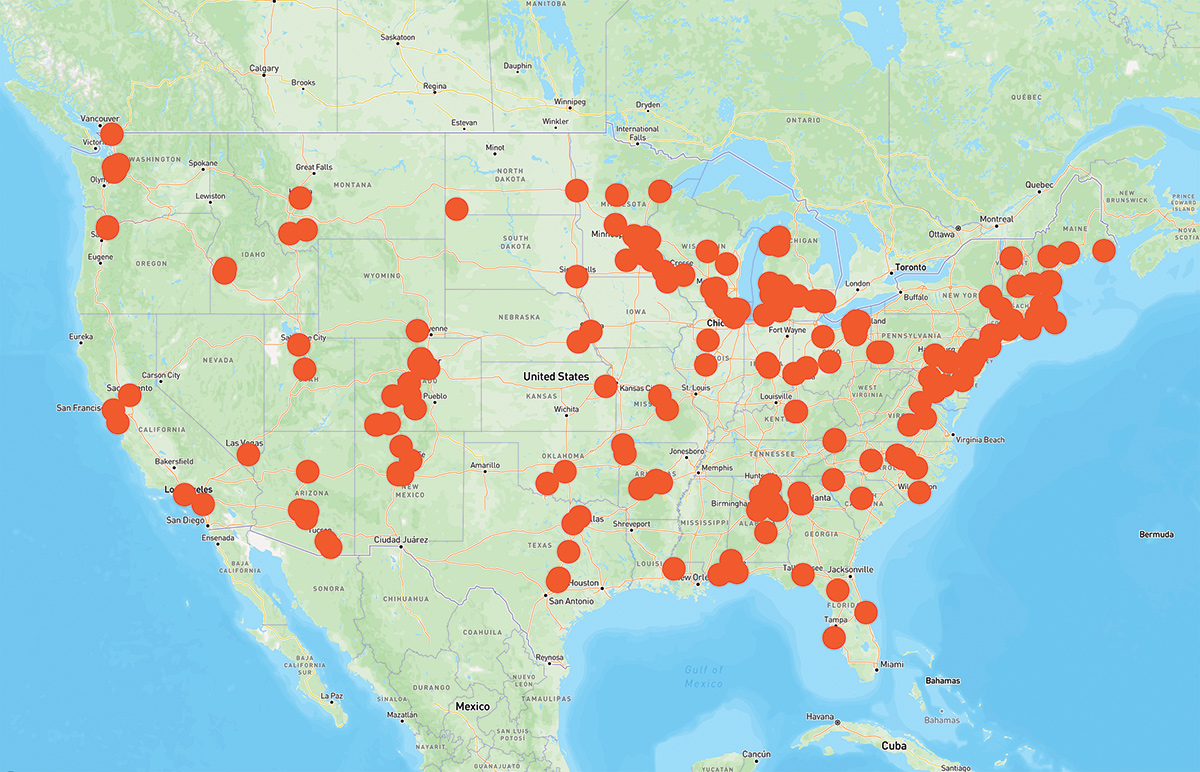
The showcase weekend will be held on Oct. 2-4, 2026 ; however, tours can take place all throughout the year. The National Solar Tour is the largest annual grassroots solar, renewable energy, and sustainable living event in the nation. Despite its name, the Tour also features a bevy of sustainable features. Check out the National Solar Tour Map to learn more about this year’s Tour.
Attend our Monthly Tour Organizer calls!
Want more information about the National Solar Tour, need assistance while planning your event, or have any questions? Join us during our Tour Organizer Calls, where we will discuss all things National Solar Tour (how to sign up, how to organize a successful Local Tour or Tour Site, and additional resources for participation).
4pm MT on the Third Thursday
Register Here
ASES recognizes the harmful effects of racism, sexism, ageism, and classism including, but not limited to implicit and unconscious bias, on individuals and society. We stand steadfastly with individuals and communities around the world who have been victims of discrimination and injustice. This is especially significant given our stated goal to achieve equitable access and transformation to a global society powered by renewable energy. Please read more about our commitment to Justice, Equity, Diversity & Inclusion (JEDI) at ases.org/JEDI.

Published for more than 38 years, Solar Today Magazine offers readers fresh insights and information about renewable energy solutions and sustainable living. Explore the magazine!
The ASES Webinar series will vary from technical content, to everyday information pertaining to solar and renewable energy, and ASES Programs like content from the National Solar Conference and the National Solar Tour. Register for our upcoming webinars today! Please support the ASES Webinar series by donating to our program.
Check out our ASES Online Community! The Ask a Renewable Energy Expert forum is a place for our ASES members to ask our team of renewable energy experts technical, solar, energy efficiency, and other sustainability- or renewable-energy-related questions. Any ASES member is welcome to join our Mentor Match Program, a unique online networking and career development tool that helps you find, connect, and share experiences with others. We hope you enjoy and take advantage of this great community partnered with the ASES Technical Divisions. Join or renew your membership for access. For more information, please review the Online Community User Guide.
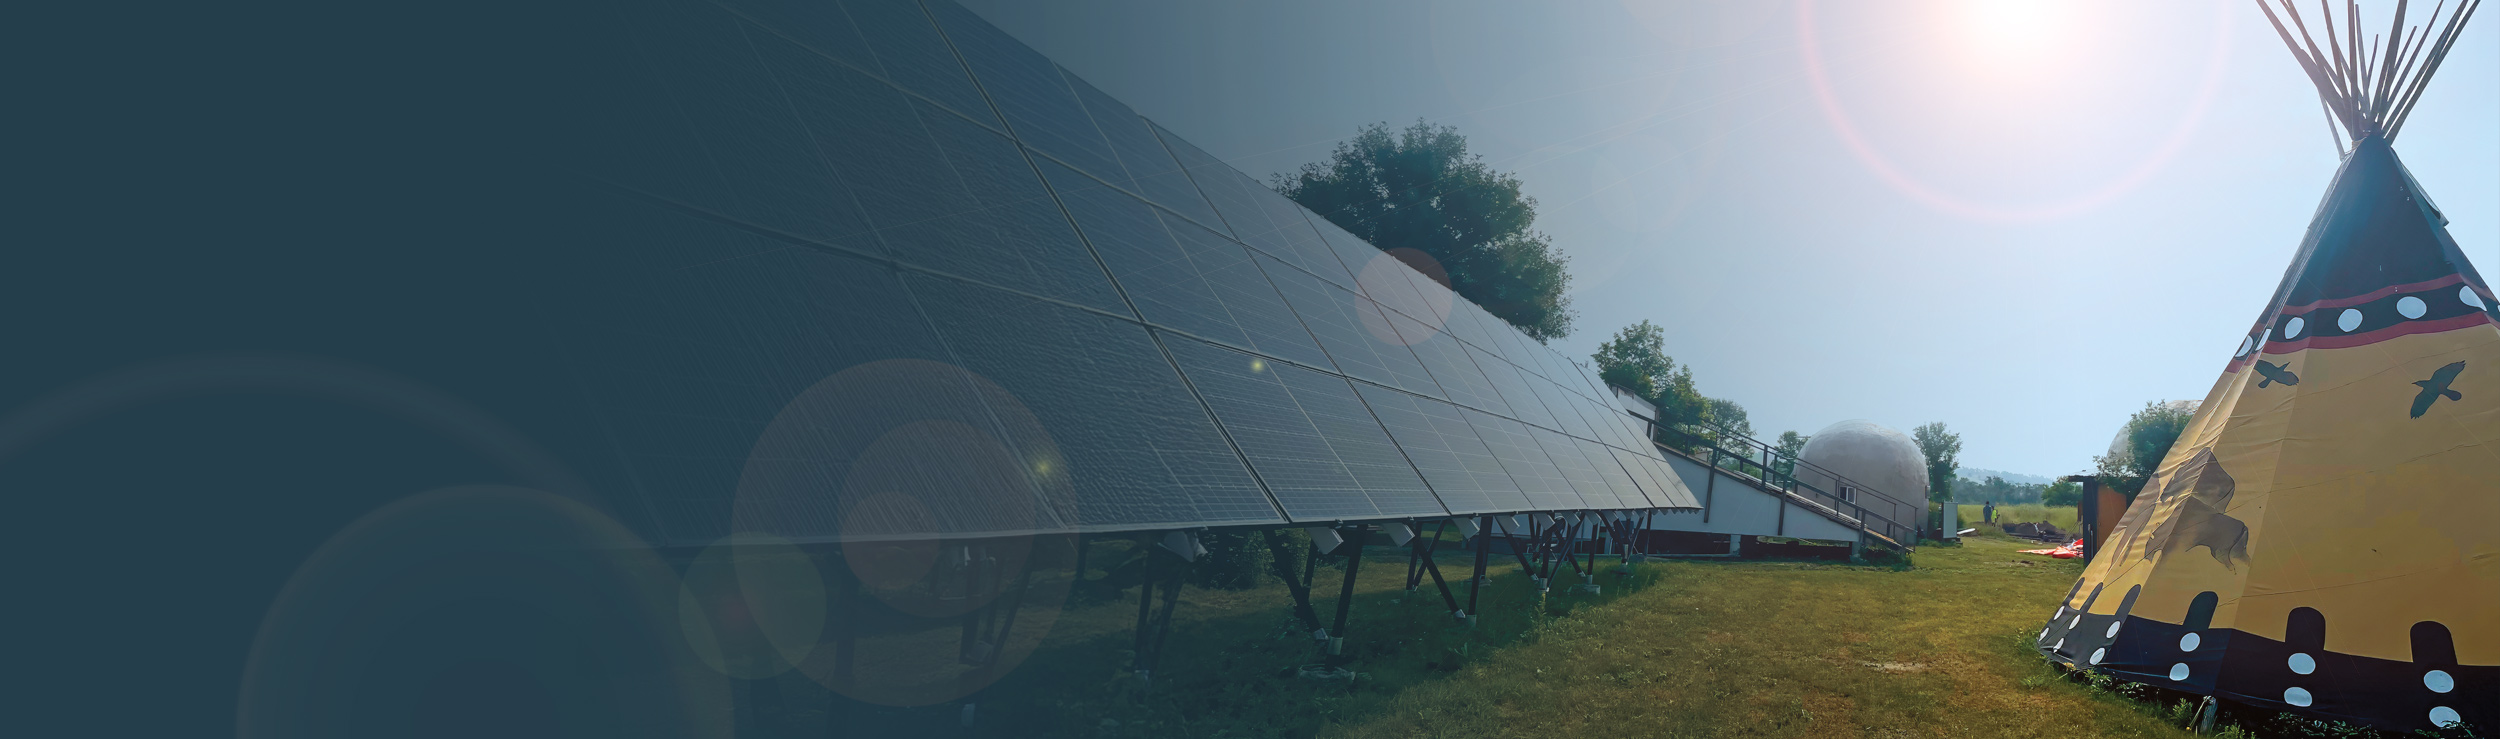
Our goal at ZEN is to provide the knowledge and the resources to each individual (like you) to help you understand how you can reduce your emissions. We recently received an EPA grant for a solar energy project at the Pine Ridge Reservation in South Dakota to advance environmental justice. Learn more
A new nationwide movement of “tiny watts”–very small applications of solar PV and solar thermal–because even small applications add up in a big way! Learn more
How AI will Revolutionize the Way We use Electricity
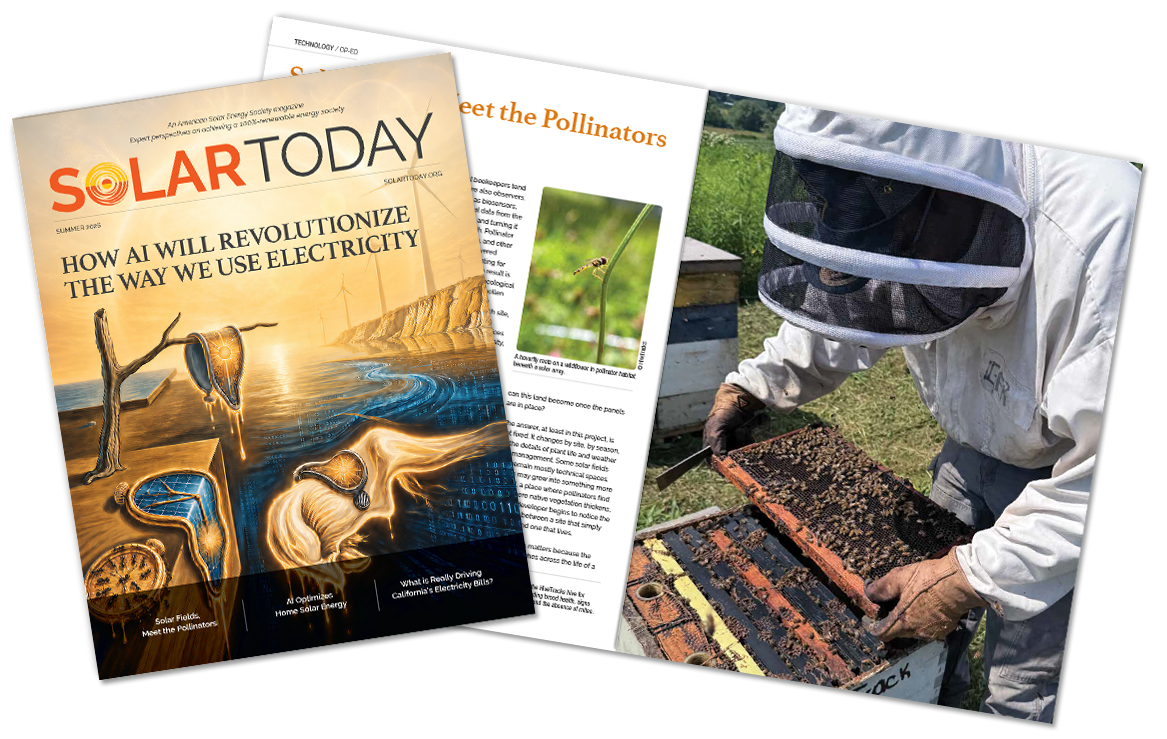
Solar Fields, Meet the Pollinators
AI Optimizes Home Solar Energy