


April 3, 2013
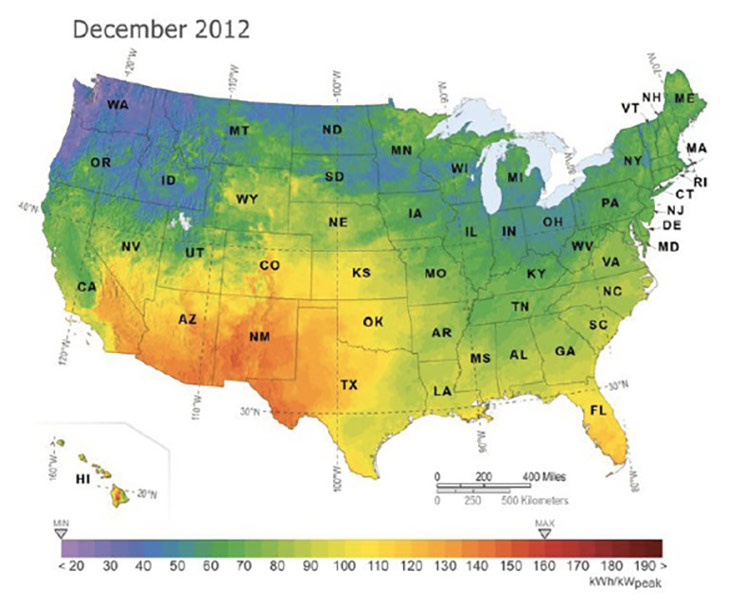
The PV Power Map is a report of national solar resource availability as illustrated by the monthly energy output of a nominal 1-kilowatt (kW) photovoltaic (PV) system by location. This issue highlights real-time production as compared to annual averages. The first map illustrates total estimated PV power output for the month of December. The second shows the average monthly PV power output in 2012.
December is typically the lowest energy production month of the year due to lower sun angles. In December 2012, the northern half of the United States experienced below-average production due to an enhanced storm pattern. Seasonal cloud formations such as the Tule fog phenomena in the Central Valley of California also impacted December power production, and the impacts are reflected in the 2012 average energy map.
Overall, PV energy output was higher in 2012 than 2011 in many locations of the United States. In particular, the Upper Midwest and Northeastern regions enjoyed significantly higher PV energy production potential during 2012 than in 2011. You can view the 2011 annual average PV production map at The PV Powermap category
To use the PV Power Map to calculate the generation potential of a PV system in a given location, multiply the power output indicated on the map by a project’s capacity, in kilowatts. The result is the total estimated power output for the month.
The PV Power Map is created with power output estimates generated by SolarAnywhere services from Clean Power Research; these include simulation capabilities and hourly satellite-derived irradiance data with spatial resolutions from 1 to 10 kilometers. The calculations are based on a PV system with a total 1-kW nameplate rating that is configured as five 200-watt PV panels with a 1.5-kW inverter; fixed, south-facing panels with 30 degree tilt; no shading; panel PVUSA Test Conditions rating of 178 watts; and inverter efficiency of 95.5 percent. Visualization and mapping provided by GeoModel Solar. Access free historical irradiance data at solaranywhere.com.