


By Adam Kankiew June 24, 2014
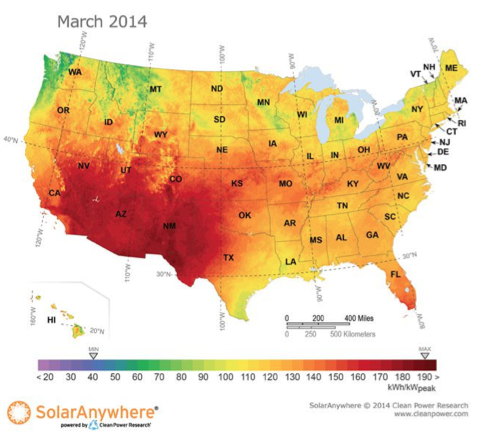
The PV Power Map is a report of national solar resource availability as illustrated by the monthly energy output of a nominal 1-kilowatt (kW) photovoltaic (PV) system by location. During March, PV energy production differed along a north-south gradient across the United States.
The southern half of the United States enjoyed above- average PV energy production during March, except for the Gulf Coast region, which experienced persistent cloud cover. Western regions of Oregon and Washington experienced lower PV energy production due to above-average precipitation from relentless Pacific storms. The Great Lakes and Northeastern United States also experienced below-average production due to unrelenting winter-like conditions that held the region in an icy grip.
The “Understanding Solar Resource Uncertainty” charts, shown below, address the question: How do energy calcu- lations derived from typical-meteorological-year (TMY3) sources compare with those derived from satellite data? Fig- ure A illustrates the spatial variability of the solar resource as observed in the Minneapolis/St. Paul, Minn., region. In this figure, the annual average global horizontal irradiance (GHI) at three National Renewable Energy Laboratory TMY3 loca- tions are superimposed on gridded SolarAnywhere typical- GHI-year (TGY) data. As can be observed, there is a much larger TMY3 GHI variance than that seen in the SolarAny- where satellite-based GHI.
Figure B shows how this GHI variance translates to annual PV energy calculations. In this case, the TMY3 variance is as much as 15 percent due to the inclusion of atypical months for two of the three TMY3 sites. The satellite-derived data in SolarAnywhere applies a consistent methodology across a spatially coherent dataset to reduce uncertainty and provide the most reliable PV energy production calculations.
The PV Power Map can be used by anyone to quickly gauge the generation potential of a new PV system, or benchmark the performance of an installed system, in a given location. Simply multiply the power output indicated on the map by a project’s capacity, in kilowatts, to calculate the total estimated power output for the month. Historical PV Power Maps from 2012, 2013 and 2014 are available at solartoday.org/pvpowermap.
The PV Power Map is created with power output estimates gen- erated by SolarAnywhere services from Clean Power Research; these include simulation capabilities and hourly satellite- derived irradiance data with spatial resolutions from 1 to 10 kilometers. The calculations are based on a PV system with a total 1-kW nameplate rating that is configured as five 200-watt PV panels with a 1.5-kW inverter; fixed, south-facing panels with 30 degree tilt; no shading; panel PVUSA Test Conditions rating of 178 watts; and inverter efficiency of 95.5 percent. Access free historical irradiance data at solaranywhere.com.