Follow us:
Donate
Sponsor a Program
Become a member
Member Login
Online Community
Since 1954
The
power
of community
Join Mailing List
| Contact Us
| Shop
About Us
About ASES
Our History
Board of Directors
Our Team
ASES Technical Divisions
Volunteer/Intern
AWARDS AND FELLOWS
JEDI
ASES Events
ASES in the News
Bylaws
Strategic Plan
Governance
Contact Us
Shop
Programs
National Solar Tour
SOLAR 2026 Conference
Conference Archives
Proceedings Archive
Tiny Watts
Zero Emissions Network
Our Community
Online Community
Business Members
Circle of the Sun
ASES Legacy Fund
Chapters
ASES Student Chapters
Bulk Buy Memberships
Gift Membership
Media Partners
Education
Solar Energy Resources for Schools
ASES Webinar Series
Inflation Reduction Act – Clean Energy Overview & Highlights
Solar Energy Workbook
Solar Trainings
Renewable Energy Home Basics
High Performance Valuation for Professionals Who Buy, Sell, and Value Real Estate
Tiny Watts
History of Solar
Scholarships
Resources
News and Stories
Feasibility and Requirements of a 100% Transition to Renewable Energy
Invest in a Clean Power Future Without Upfront Costs
Claim Your Solar Tax Credit
Questions to Ask an Installer
Solar@Work Newsletter Archives
Media Room
Solar Performance
Historical Reports
ASES Archives
Jobs Board
Solar Today Magazine
MENU
Quick Actions
Donate
Sponsor a Program
Become a member
Member Login
Online Community
About Us
About ASES
Our History
Board of Directors
Our Team
ASES Technical Divisions
Volunteer/Intern
AWARDS AND FELLOWS
JEDI
ASES Events
ASES in the News
Bylaws
Strategic Plan
Governance
Contact Us
Shop
Programs
National Solar Tour
SOLAR 2026 Conference
Conference Archives
Proceedings Archive
Tiny Watts
Zero Emissions Network
Our Community
Online Community
Business Members
Circle of the Sun
ASES Legacy Fund
Chapters
ASES Student Chapters
Bulk Buy Memberships
Gift Membership
Media Partners
Education
Solar Energy Resources for Schools
ASES Webinar Series
Inflation Reduction Act – Clean Energy Overview & Highlights
Solar Energy Workbook
Solar Trainings
Renewable Energy Home Basics
High Performance Valuation for Professionals Who Buy, Sell, and Value Real Estate
Tiny Watts
History of Solar
Scholarships
Resources
News and Stories
Feasibility and Requirements of a 100% Transition to Renewable Energy
Invest in a Clean Power Future Without Upfront Costs
Claim Your Solar Tax Credit
Questions to Ask an Installer
Solar@Work Newsletter Archives
Media Room
Solar Performance
Historical Reports
ASES Archives
Jobs Board
Solar Today Magazine
Information is
power
Technology
Solar
Wind Power
Transportation
Building Design
Other Renewables
Hybrid Systems
Storage
Grids
Strategies
Research
Thermal
Inverters
Industrial PV
PV Power Map
Community
Students
Chapters
Divisions
Emerging Professionals
Solar Citizen / Solar Nation
Policy
Legislation/Policy
National
State
Local
Regional
International
Climate, Air, Water, Food
Advocacy
Federal
Clean Air Act
Lifestyle
Solar Basics
Sustainable Living
Consumer Options
Off Grid Living
Efficient Homes
Business
New Products
Software
Business News
World Energy
Subscribe
About
Advertise
Archives
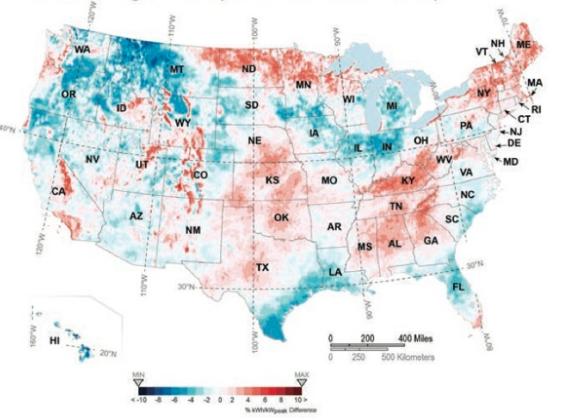
PV Power map
March 18, 2015
PV Generation Potential for 2014
Switch Language »