


Adam Kannkiewicz March 18, 2015
2014 Average Monthly PV Power Variance
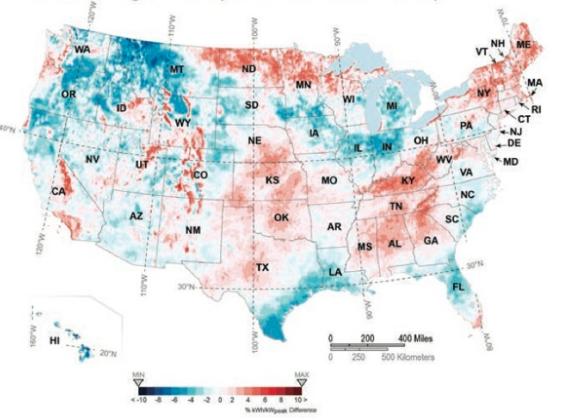
PV Power Maps illustrate national solar resource availability by showing the energy output of a nominal 1-kilowatt (kW) photovoltaic (PV) system by location. This issue features a map of the average monthly PV power output in 2014. Also featured is a PV Power Variance Map, which highlights how the average energy production in 2014 compared with the typically expected long-term annual energy production.
As can be seen in the PV Power Variance Map, several regions experienced noteworthy above and below swings in PV energy production in 2014. Above-average PV production was realized across portions of the western, southwestern, and south central United States, as well as the Mississippi Valley, due to dry conditions over the regions. Below-average PV energy conditions dominated the Gulf Coast and Florida regions, as well as the Great Lakes and northeastern United States due to wetter and cloudier-than-average conditions.

The PV Power Map can be used by anyone to quickly gauge the generation potential of a new PV system or bench.mark the performance of an installed system in a given location. Simply multiply the power output indicated on the map by a project’s capacity, in kilowatts, to calculate the total estimated power output for an average 2014 month.
For example, a 4-kW PV system in San Diego, California, would have produced approximately 580 kilowatt-hours (kWh) during an average 2014 month (145 kWh x 4 kW = 580 kWh), which was about 2.5% above the typical monthly production. Meanwhile, a 4-kW system in Houston, Texas, would have produced approximately 440 kWh (110 kWh x 4 kW = 440 kWh), which was about 3% below the typical monthly production.
To gain an understanding of the production of a particular system over a period of time, you can view historical PV Power Maps from 2012, 2013, and 2014 at solartoday.org/pvpowermap.
The PV Power Map is created with power output estimates generated by SolarAnywhere services from Clean Power Research; these include simulation capabilities and hourly satellite-derived irradiance data with spatial resolutions from 1 to 10 kilometers. The calculations are based on a PV system with a total 1-kW nameplate rating that is configured as five 200-watt PV pan.els with a 1.5-kW inverter; fixed, south-facing panels with 30 degree tilt; no shading; panel PVUSA Test Conditions rating of 178 watts; and inverter efficiency of 95.5%. Access free historical irradiance data at solaranywhere.com.
Adam Kankiewicz (askcpr@cleanpower.com) is a research specialist at Clean Power Research.