By Scott Sklar April 14, 2020
Energy Efficiency
Energy efficiency is the lowest cost energy-saving measure according to the American Council for an Energy-Efficient Economy. Even after the assaults by the Trump Administration to turn back years of bipartisan efforts, energy efficiency measures are growing, saving consumers money and reducing fresh water use, pollution, and greenhouse gas emissions. A report from the American Council for an Energy-Efficient Economy (ACEEE) states energy efficiency could cut U.S. energy usage in half by 2050. A new report from Navigant Research says annual energy efficiency spending in North America is expected to reach nearly $11.3 billion in 2028, with a compound annual growth rate of 4.6% over the forecast period of 2019-2028.
A new report from the American Council for an Energy-Efficient Economy concludes that energy efficiency could cut US energy use and greenhouse gas emissions by 50% by 2050. The report, “Halfway There: Energy Efficiency Can Cut Energy Use and Greenhouse Gas Emissions in Half by 2050,” builds on previous studies from sources including the International Energy Agency and the Natural Resources Defense Council. Lawrence Berkeley National Laboratory looked at efficiency programs funded by customers of investor-owned utilities.
Thirty states and the District of Columbia have adopted efficiency policies, including two dozen that adopted an energy efficiency resource standard. While the figure is highly variable, depending on geography and demographics, it costs an average of $0.025 to save a kilowatt-hour (kWh) of electricity. Costs were lower in the Midwest where utilities have less experience with efficiency programs and more low-hanging fruit; in the Northeast, the cost reached $0.033/kWh. According to a report by Navigant in 2019, the global penetration rate of smart meters was 41.2%, which is expected to rise to nearly 59% by 2028.
Renewable Energy Sources
The U.S. Energy Information Administration (EIA), on January 30, 2020, expects U.S. electricity generation from renewable energy to soon surpass nuclear and coal; in the “Annual Energy Outlook 2020,” EIA projects electricity generation from renewable sources to surpass nuclear and coal by 2021 and to surpass natural gas in 2045. The share of renewables in the U.S. electricity generation mix is forecasted to increase from 19% in 2019 to 38% by 2050.
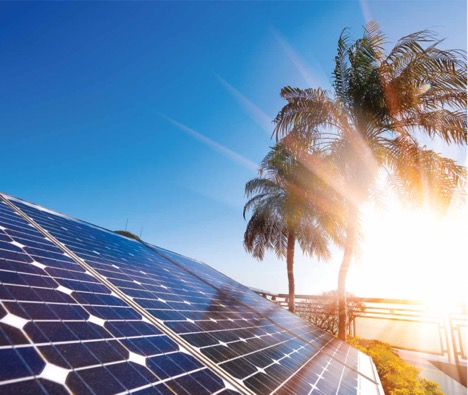
Solar Power
The report “2020 Global Photovoltaic Demand Forecast” by IHS Markit says global solar installations will spike 14% in 2020, adding 142 GW, according to Emily Holbrook . The expected 142 GW are seven times that of the entire capacity that had been installed as of 2010. There were just seven countries with more than 1 GW of installed capacity in 2010, most of them confined to Europe. IHS Markit expects more than 43 countries to meet that threshold by the end of 2020.
Wind Power
The global wind power industry is expected to increase tenfold and install more than 626,800 MW of new capacity over the next decade. Onshore and offshore wind power is being developed in more countries. This new capacity represents a market worth more than $92 billion in 2019 and more than $1 trillion over the next decade. Global offshore wind development is expected to experience a 16% compound annual growth rate over a 10-year forecast period. China, Taiwan, and Europe are the leading markets, with the U.S. soon to join when the first large-scale offshore wind plants are commissioned in coming years along the northeast coast.
The American Wind Energy Association (AWEA) reported, “In Its Third Strongest Year, Wind Industry Added 9,143 MW of Wind Power to the U.S. Grid in 2019,” on January 29, 2020. In AWEA’s “U.S. Wind Industry Fourth Quarter 2019 Market Report,” the wind industry experienced its third strongest year on record in 2019 as project developers added 9,143 megawatts of wind power capacity to the grid, enough to power over three million American homes.
There are now 105,583 MW of operating wind capacity in the U.S. with more than 56,800 wind turbines operating across 41 states. In addition, another 44,000 MW of wind projects – representing over $62 billion in investment – are either under construction or in advanced development. Utilities and businesses also set a new record in 2019, announcing 8,726 MW in new Power Purchase Agreements.
East Coast states continue to drive demand for offshore wind energy with 16 GW in new offshore wind targets pledged in 2019, more than doubling previous state targets. The fourth quarter of 2019 alone saw significant growth as developers installed 35 new wind projects totaling 5,476 MW in 16 states. Texas led installations for the quarter with 1,808 MW, followed by Iowa, South Dakota, North Dakota, and Illinois.
Energy Storage
The same trend is true for energy storage, both alone and tied to solar and wind. Fialka (2020) reported that what had started as an experiment with solar energy and large storage batteries in Hawaii in 2016, has inspired a $2.8 billion global explosion of investments and mergers in 2019 – an increase of 103%. As part of this expansion, Royal Dutch Shell PLC bought Sonnen GmbH, a pioneering German company engaged in linking up homes powered by solar arrays and battery storage, in February 2019.
Following this, two large electric utilities promised to light up parts of Florida and California with renewable energy-powered battery storage plants. Each of them described their project as the largest of its kind in the world. In November 2019, UBS AG, a Swiss multinational investment bank and financial services company, published a report stating energy storage costs could drop more than two-thirds by 2025 and future demand for renewable energy could triple. Additionally, UBS AG concluded that the global market’s value would be six times what it is worth now by 2030.
Geo-Power
According to Zion Market Research (2019), the global geothermal energy market was valued at USD 9 billion by 2025, at a CAGR of around 11% between 2019 and 2025.
Bio-Power
According to the REN21 Report by the World Bank, global bio-power capacity increased by about 6.5% in 2018, an increase from 121 GW to 130 GW. Total bioelectricity generation rose 9%, from 532 terawatt-hours (TWh) in 2017 to 581 TWh in 2018. The EU remained the largest generator by region, with generation growing 6% in 2018, rising from 39 GW to 42 GW, stimulated by the Renewable Energy Directive. In other regions, generation in Asia grew 16% and generation in North America remained essentially stable. In Asia, bio-power capacity grew most rapidly in China – up 14% in 2018. The increase from 21% to 17.8 GW in 2018, is in line with the provisions of the country’s 13th Five-Year Plan from 2016 to 2020.
Elsewhere in Asia, India’s biopower capacity increased 16% to 10.2 GW and generation rose 4% to 50 TWh. Capacity and generation growth also remained strong in Japan, where the capacity of dedicated biomass plants increased 11% to reach 4 GW, stimulated by a generous Feed-In-Tariff. Biomass generation increased 50% in the Republic of Korea, 39% in Thailand, and even doubled in Vietnam. Globally, China remains the top bioelectricity-producing country, followed by the United States, Brazil, Germany, India, the United Kingdom, and Japan.
Water Power
Water energy, including existing dams and marine energy, is also typically underappreciated, especially considering the majority of the global population lives near a coast. The Department of Energy’s Oak Ridge National Laboratory (ORNL), assessed the ability of existing non-powered dams across the country to generate electricity. The 80,000+ non-powered facilities represent the vast majority of dams in the country; more than 90% of dams are used for services such as regulating water supply and controlling inland navigation, and lack electricity-generating equipment. The study found that the nation has over 50,000 suitable non-powered dams with the technical potential to add about 12 gigawatts (GW) of clean, renewable hydropower capacity. The 100 largest capacity facilities—primarily locks and dams on the Ohio, Mississippi, Alabama, and Arkansas rivers operated by the U.S. Army Corps of Engineers—could provide 8 GW of power combined.
Both the International Energy Agency (Paris) and the Energy Information Administration (Washington, DC) are beginning to seriously track marine energy. According to EIA (2019), waves form as wind blows over the surface of open water in oceans and lakes and those waves contain tremendous energy. The theoretical annual energy potential of waves off the coasts of the United States is estimated to be as much as 2.64 trillion kWh, or the equivalent of about 64% of U.S. electricity generation in 2018. The west coasts of the United States and Europe, and the coasts of Japan and New Zealand, have potential sites for harnessing wave energy. Many different methods and technologies for capturing and converting wave energy to electricity are under development.
The most recent data states that electricity generation from marine technologies increased an estimated 3% in 2018. Advanced marine projects for power generation, ranging from 10 kW to 1 MW, have been deployed primarily in the United Kingdom, Canada, Australia and China. However, these demonstration and small commercial projects remain expensive and have not yet achieved the economies of scale necessary for significant cost reductions. A report issued by Research Nester that the global wave and tidal energy market is expected to account for a market value of USD 15 billion by the year 2027 with a CAGR of 24% over forecast period i.e. 2019-2027.
Financing Renewable Energy
Finally, one of the most important trends is in the financial sector. There are an impressive set of financial firms that are setting new priorities and approaches to increase renewable energy. BlackRock, the world’s largest asset manager, has a new multibillion-dollar renewable energy fund in the works, with a focus on energy storage. BlackRock has been a major global investor in wind and solar energy, but the firm’s new focus on energy storage led to its acquisition of GE’s distributed solar and storage business in 2019.
GreenTech Media reports, “Since 2011, BlackRock claims to have channeled $5.5 billion into more than 250 wind and solar projects around the world. Its first renewables private-equity fund drew around $600 million of commitments from big investors. The second, launched a few years later, brought in $1.65 billion. With its third “vintage,” known as the Global Renewable Power III fund, BlackRock is targeting $2.5 billion of commitments and in December 2019, they announced a record $1 billion first close.” Wood Mackenzie forecasts blistering growth in the American energy storage market over the next five years, rising twelvefold from 430 MW in 2019 to more than 5.4 GW in 2024. Many large storage facilities will be paired with solar plants, while a smaller subset will be coupled with wind farms in congested parts of the grid.
According to Justine Coleman of The Hill, Goldman Sachs announced plans to invest $750 billion over the next decade toward fighting climate change. The funding will go to five areas of sustainable development to assist companies in climate transition, including clean energy, sustainable transport, food and agriculture, waste and materials, and economic systems. The bank committed to working with their clients as they navigate sustainability by funding “sustainable growth themes” for climate transition and inclusive growth finance for underprivileged people.
Private equity giant, Carlyle Group, intends to invest $100 million in developing, acquiring, financing and operating U.S. solar projects through a new partnership with Missouri-based firm Alchemy Renewables. The Carlyle Group will invest through its new affiliate, Cardinal Renewables. Alchemy Renewables will provide asset management services, place tax equity financing and manage operations and maintenance services while Cardinal Renewables will acquire projects. Alchemy Renewables has been involved in the development, construction and operation of more than 850MW since its founding in 2016 and its existing portfolio counts 38 projects in eight states.
Bloomberg Green reported in January 16, 2020, “Even Under Trump, U.S. Renewable Investment Hit a Record in 2019,” . Here Rathi and Hodges report, “U.S. renewable energy industry doesn’t seem to take much notice of President’s views on green energy and climate change as investments surged to a record last year.” New investments were buoyed by wind and solar companies rushing to qualify for federal tax credits being scaled back this year. A total of $55.5 billion was spent in the renewable energy sector last year, an increase of 28%, second only to China and beating Europe. Virtually all indices show markets, investors and commercial, industrial, institutional, and government energy users are all moving in the direction of clean energy. This is good news for consumers, the economy, global security, human health, and greenhouse gas emissions stabilization.
Useful resource with interactive maps on renewable energy consumption statistics: https://ourworldindata.org/renewable-energy
Scott Sklar is an Adjunct Professor at The George Washington University (GWU) teaching three interdisciplinary sustainable energy courses, leads GWU’s Environment & Energy Management institute, and runs The Stella Group, Ltd, a 20 year-old global clean energy owners’ representatives company. He can be reached at solarsklar@aol.com.