


By Dave Menicucci October 22, 2013
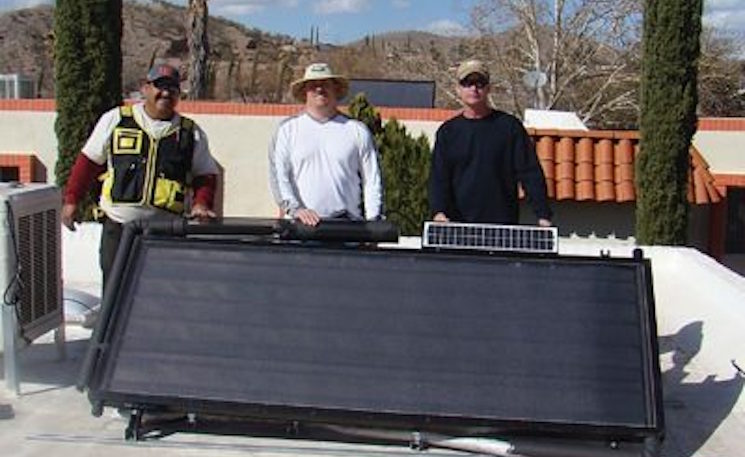
Direct monitoring for SHW is costly. Thus, researchers focused on addressing reliability issues using only those sensors that are normally employed to operate a SHW system. Photo: Butler Sun Solutions
Adaptive resonance theory (ART), a form of artificial intelligence developed at Boston University, has been a subject of study and experimentation for decades. But on a fall afternoon in 2009 in a meeting with two of my colleagues at the University of New Mexico (UNM), it was brought to bear on a problem that had confounded the solar engineering community for many decades: how to accurately characterize the reliability and real electric grid impact of solar hot water (SHW) systems.
ART is a family of artificial neural networks with the unique capability to learn in a manner similar to a biological organism, although with less sophistication. A simulated ART network is structured like a brain, with a network of neurons that interact with one another in a way that it can identify and characterize patterns of system behavior.
To understand how this works, consider how people learn about others. Upon introduction, strangers recognize each other as being people. But over time, they learn how certain facial expressions imply certain conditions — anger, disgust, contentment and so on. With more learning, each might be able to associate certain conditions with typical behaviors — an angry expression that typically leads to a raised voice.
UNM professors Andrea Mammoli, head of the Mechanical Engineering Integrated Sustainable Energy Systems Lab, and Thomas Caudell of electrical and computer engineering, had been experimenting with ART. In our meeting they suggested its applicability to the SHW reliability question. ART, they said, might help us to garner insights into system behavior, such as operational degradation that might precede a catastrophic failure. It might also be able to detect failures in fielded systems by analyzing consumer load data that a utility typically collects.
Four years later, our research using ART technology with an SHW testbed and with fielded SHW systems suggests great promise for demonstrating these systems’ reliability and real benefits for the electric grid. Through its development in many other applications, from photovoltaic plants to the stock market, ART is proving an effective analysis tool with potentially revolutionary capability.
“Training” ART to Detect System Failure
Utility encouragements have spurred many new SHW installations, resulting in significant energy production. But solar generators operate intermittently, and the utilities want to know with certainty the dependability and amount of the energy and demand that the SHW systems could save from their grids. Demand is a technical term to describe the maximum power requirements by a consumer in a specific time period. For utilities, spikes in demand that result from simultaneous operation of multiple loads are burdensome, and they welcome any mitigation.

Reliability engineering, a well-developed science, is one reason we can safely fly on airplanes. But these safety levels evolved from a plethora of historical operational data for every airplane component.
The problem is that while hundreds of SHW systems have been monitored, most efforts centered on the energy performance early in a SHW system’s life. Even manufacturers and installers had recorded very little data from installed systems beyond their one- or two-year warranty periods.
In 2008, Sandia National Labs funded me to study SHW reliability data, but I found few to study. Some of the best were from a Florida Solar Energy Center (FSEC) field survey of 151 10-year-old systems in Florida, in which researchers discovered that more than half of the pumped systems (those requiring a mechanical pump to circulate the heat-transfer fluid through the collector) were offline. Little is known about the life cycle of SHW systems.

Greg Kolb, then a research engineer at Sandia, asked me to develop a plan to address the utility’s reliability questions. However, economics complicate the problem. A typical SHW system may displace 2,000 kilowatt-hours of electricity a year, worth about $300 at residential rates of $0.15 per kilowatt-hour. With such small savings as a backdrop, expensive monitoring is limited, especially if it involves field surveys like FSEC’s. Thus, any new reliability-related technology should address this problem using only those sensors that are normally employed to operate a SHW system. These include two temperature sensors, one on the collector and one on the tank.

We began to develop some testable hypotheses. We theorized that ART might be able to detect faults in a SHW system based solely on these two temperature sensors. This problem is deceivingly difficult. If fluid is not flowing in the collector when the sun is shining, the collector will be hot. This stagnation could be caused by a failed solar loop pump. But a fully operational system would also stagnate if the solar tank were saturated with heat.
Adding more sensors to the system, such as a flow meter and radiation sensor, would help to differentiate these two conditions, signaling any failure with precision. But differentiating these two conditions with only two temperature sensors is quite challenging.

An intelligent human being who is very familiar with the system could use experience to differentiate the conditions. For example, a person may have learned that at a certain time of the day, the pump tends to shut down. But stagnation at a different time would portend a problem.
We believed that we could program an ART network and educate it (called “training”) on the performance of a SHW system. Essentially, we thought we could develop an artificial ART-based overseer of the system, one with some measure of artificial intuition based solely on the normally installed sensors. Such a capability easily could be built into existing controllers, greatly enhancing the reliability of the SHW systems with inconsequential cost increase.
We proposed a research plan that specified the creation of an SHW testbed that would allow us to test our hypotheses. Using the testbed, we would train ART on the operation of the system and then test its ability to detect various intentionally induced system degradations and failures. Sandia funded our proposal, and we built a fully instrumented SHW testbed. The National Renewable Energy Laboratory (NREL) and UNM contributed hardware.
Utilities want to know with certainty the dependability and amount of the energy and demand that the SHW systems could save from their grids.
Hongbo He, then a Ph.D. candidate, created a computerized ART network for our experiments. He also developed a TRNSYS model of the testbed’s SHW system and used the model to train the ART system on normal system operation. (TRNSYS is the Transient System Simulation Tool, a verified and accurate model typically used to model the energy performance of solar thermal systems.) Training consisted of running the model repeatedly over several days using as input eight years of Albuquerque’s historical weather data taken from NREL’s SOLMET database. The result was an ART network that was trained on normal SHW operations and therefore primed to detect irregularities.
Our tests produced startling results. For example, we simulated a pump failure. Using only the system’s two temperature sensors, the ART network immediately identified the failure and differentiated it from normal pump shutdowns.
In a more rigorous test, we slowly reduced the pump flow rate over several days, as might occur when a motor is failing due to shorts developing in the motor windings. ART was able to recognize the degraded condition at an early stage.

In this graphic the test hour number is plotted along the horizontal axis. The severity level, as determined through the ART network, is plotted along the vertical axis. The colored zones show the hours where the flow rate was reduced and by how much. For example, from hours 1416 through 1440, the flow rate was reduced by 10 percent from normal. The blue dots show the instances where the ART network identified an abnormal condition. The uncolored zone on the far right shows that ART found essentially no problems after we returned the flow rate to its normal level. ART remarkably detected the degraded SHW condition using only the two temperature sensors that normally accompany a residential SHW system.
Demonstrating Real Utility Benefits
Last year we applied ART in a real utility application. Our research focused on two particularly vexing problems: 1) What is the real impact of SHW on the utility grid, and 2) What is the actual reliability of the fielded systems?
While many SHW systems have been monitored, almost all of the measures were of the energy performance of the SHW systems’ solar loop. The question is, how much of that energy actually results in energy and demand savings on the grid?
The Solar Rating & Certification Corp. (SRCC), in Cocoa, Fla., assigns energy savings ratings to SHW systems, but it is understood that these ratings have never been rigorously verified in many locations. Utilities are seeking direct measures of the SHW impact to their grids.
We studied five homes in a Southwestern United States location. Each of these homes had SHW systems installed roughly in the middle of the record of study, which ran from three to four years. The records for each home consisted of hourly energy consumption measures taken from smart meters.
ART was again instrumental in the analysis. Since the SHW energy signature is a relatively small one in the home’s overall energy consumption, and because we were comparing the home’s energy use before and after the SHW was introduced, it was critical to know with reasonable precision the date of installation.
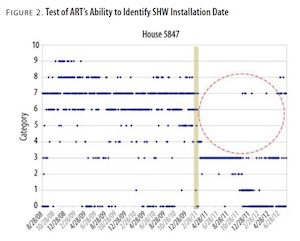
We successfully used ART networks to identify the SHW installation date in each home by plotting the history of each home’s energy use patterns over time. Figure 2, above, shows the results for one home.
The horizontal axis shows the date. The vertical axis shows indices of the unique energy usage patterns in the home. Each blue dot represents a particular energy usage pattern for a day, called a “category.”
A quick visual review of the plot shows that around March 1, 2011, the home’s energy characteristics changed dramatically, with categories 4, 5, 6 and 9 disappearing and categories 7 and 8 occurring much less frequently (compare red circled area with previous times). This suggested a solar system installation around March 1 — as shown with the yellow bar — and we used that date in the middle of the bar for our statistical analysis.
We performed similar analyses on the other four homes. Our analysis estimated the direct impact of the SHW system on the electric grid. The results are shown in figure 3.
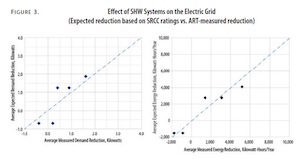
In both plots the expected reduction of energy and power demand is shown on the vertical axes. The expectations are based on the SRCC ratings for each SHW system. The measured reductions are on the horizontal axes. A perfect relationship is noted with the dashed lines.
There are two noteworthy aspects of the plots. First, some of the measured reductions were negative, which resulted from older twopanel systems being replaced with new singlepanel ones. Second, the relationship between the SRCC ratings and the measured impact to the grid are closely coupled, indicating that, at least in these cases, the SRCC energy savings ratings are reasonably accurate. As funding becomes available, we must study more homes before drawing any broader conclusions about SRCC ratings or SHW systems’ impact on the grid.
Equally important, we were able to demonstrate that ART can identify not only when a SHW system is installed, but also when it fails. We had no data that contained a real SHW failure, so we simulated one. And ART successfully identified both dates in the simulations.
A Key to Realizing Solar’s Full Value?
We believe that the ART system could be automated, scanning the smart meter data as they flow into the utility’s database. SHW failures could be automatically identified, producing plentiful reliability data at essentially no cost beyond developing and implementing this system.
One of the advantages of ART is its computational efficiency, which allows it to be programmed into small computers, such as SHW controllers, effectively giving these devices a measure of intelligence. Such capabilities, if developed, would represent a breakthrough to more thoroughly understanding SHW reliability and performance.
ART applications are expanding. Birk Jones, a UNM Ph.D. candidate in mechanical engineering, is applying ART methods to refine building energy performance. Anthony Menicucci, also a Ph.D. candidate, is using ART to predict the solar resource in real time, which is of interest to utilities with large photovoltaic plants. We are also discussing with several utilities the application of ART to a wider range of utility systems, such as PV plant degradation, power plant reliability and reliability of distribution transformers.
Dave Menicucci (dfmenic@unm.edu) has spent 42 years in energy research. He is retired from Sandia National Labs and heads Building Specialists Inc., an energy research company. He also serves part-time as a research associate professor of engineering at the University of New Mexico.